Bottom Line Up Front
Ten detached homes closed in San Diego Country Estates in October 2026, up from 5 in September. With 35 homes listed, months supply of inventory fell from 7.6 back to 3.5, inside the balanced range. September's slow month was a pause, not a turn.
But the buyers who came back negotiated. Seven of the 10 October sellers accepted less than their original asking price, averaging 96 percent of it, and the median home took 47 days to sell. Prices held: median price per square foot was $390, essentially even with $386 a year ago.
What sold in SDCE in October 2026
Ten detached homes closed in San Diego Country Estates between October 1 and October 31, 2026. The price range was $658,500 to $1,050,000, and one home closed above $1 million for the first time since July.
Here is the snapshot of the month, with comparison to September 2026 for context.
| Metric | September 2026 | October 2026 |
|---|---|---|
| Detached homes closed | 5 | 10 |
| Median sold price | $818,000 | $782,500 |
| Average sold price | $844,380 | $799,750 |
| Median price per square foot | $351 | $390 |
| Median days on market | 30 | 47 |
| Median sold-to-list price ratio | 99.8% | 100.0% |
| Sold at or above final asking price | 2 of 5 | 6 of 10 |
| Sold at or above original asking price | not tracked | 3 of 10 |
| Active listings | 38 | 35 |
| Months supply of inventory | 7.6 | 3.5 |
A note on the data. Starting this month, detached-style homes in common-interest communities are counted with detached homes. They are legally condos, but they compete with single-family homes, not townhomes. One such home closed in October at $658,500. Earlier months' figures are shown as originally published.
Reading between the numbers
Last month's open question got its answer. In September I wrote that five sales could mean a timing gap or the start of a real slowdown, and that the nine homes in escrow pointed toward a timing gap. October's ten closings say it was the gap. Active listings also eased from 38 to 35.
The median fell, but values did not. The median sold price dropped from $818,000 to $782,500. The median home that closed in October measured 2,034 square feet, against 2,194 in September. Smaller homes sold, and median price per square foot rose from $351 to $390. For the third month running, the headline median and the per square foot price moved in opposite directions. Against October 2025, the market is close to flat: $782,500 against $770,000, and $390 a square foot against $386.
The negotiation moved to the original asking price. The sold-to-list ratio says sellers got full price, 100 percent at the median, and 6 of 10 sold at or above their final asking price. But that compares against the price after any reductions. Against the price each home first listed at, only 3 of 10 got their number, and the average sale came in at 96 percent of original asking. On a typical SDCE home, that gap is roughly $30,000.
Homes took longer to sell. Median days on market rose from 30 in September to 47, after 21 in August. That is two straight monthly increases. One home sold the day it listed. Four took longer than 60 days.
The honest read
October answered one question and raised another. Buyers did not disappear. Ten closings and 7 homes in escrow say demand is there at today's prices. What changed is who sets the price. In the spring, sellers listed and buyers met the number. This fall, buyers are taking their time, and most sellers are meeting buyers somewhere below where they started.
The one sale above $1 million is the clearest example. It closed after 61 days at about 18 percent below its original asking price. That is one sale, not a pattern, but it fits what the wider Ramona data shows about the upper price ranges.
Where October 2026 sales clustered
- Two sales below $700,000
- Four sales between $725,000 and $790,000
- Two sales between $809,000 and $850,000
- Two sales at $905,000 and $1,050,000
The average of $799,750 sits about $17,000 above the median, pulled up by the two highest sales. Six of the ten closed under $800,000, which is where most of the October action was.
Months supply of inventory in SDCE
Months supply of inventory tells you whether a market favors buyers or sellers. Divide the current number of active listings by the monthly sales pace. The result is how long it would take to sell every listed home if no new listings came on the market.
- Less than 3 months: seller's market. Limited supply, buyers competing.
- 3 to 6 months: balanced market. Neither side has strong leverage.
- More than 6 months: buyer's market. Excess supply, sellers compete for buyers.
For San Diego Country Estates detached homes in October 2026:
- Active listings at month end: 35
- October closed sales: 10
- Months supply of inventory: 35 / 10 = 3.5 months
The running record is now seven readings deep: 2.2 months in April, 2.6 in May, 3.6 in June, 3.7 in July, 3.7 in August, 7.6 in September and 3.5 in October. Against the three month average pace of about 8.7 sales a month, the same 35 listings work out to about 4.0 months. Either way, balanced.
This is why one month earns a footnote, not a label. September's 7.6 looked like a buyer's market. October put it back where the summer had been. The steadier signal is the drift since spring, from the low 2s to the high 3s, and that drift has held.
Thirteen of the 35 active listings have been on the market 60 days or longer, and the median active listing has been sitting 46 days. Twenty of the 35 have already cut their price. Twenty five are priced between $700,000 and $900,000, the heart of the community's market. Seven homes are in escrow heading into November, down from nine a month ago.
What this means for SDCE sellers
If you are considering selling in the next 90 days, three observations from October 2026 worth carrying into your decision.
The buyers are there. Ten closings and seven escrows say demand did not dry up after September. You do not need to wait for the market to come back. It came back.
Your original price is the number that matters most. Seven of ten October sellers ended up below it. The homes that got their number priced to recent sales from the first day. A price set on hope tends to become a price cut after a month or two of showings, and by then the listing has lost its fresh-on-market attention.
Expect a longer runway. The median sale took 47 days this month. Plan your timing around six to eight weeks to an accepted offer, not two.
What this means for SDCE buyers
You have leverage, but it is specific, not general. Twenty of the 35 listings have already cut their price, and thirteen have been on the market more than 60 days. Those are the homes where a below-asking offer, seller credits or a rate buydown are reasonable conversations.
What the data does not support is expecting a discount on everything. Prices per square foot are flat with a year ago, and one October home sold the day it listed. A well-priced home in the middle of the market can still go quickly.
How does this compare to Ramona overall?
In October 2026, Ramona-wide detached homes posted a median sold price of $790,000 across 29 closings, close to SDCE's $782,500 on 10 sales. The Country Estates accounted for about a third of Ramona's detached closings, the same share as in September. Months supply was nearly identical, 3.7 town wide against 3.5 here.
The difference again was speed. Ramona-wide homes sold in a median of 30 days, against 47 in the Country Estates. SDCE homes compete most directly with each other, similar ages, floor plans and HOA, which may make buyers here more deliberate. That is a working read, not a finding.
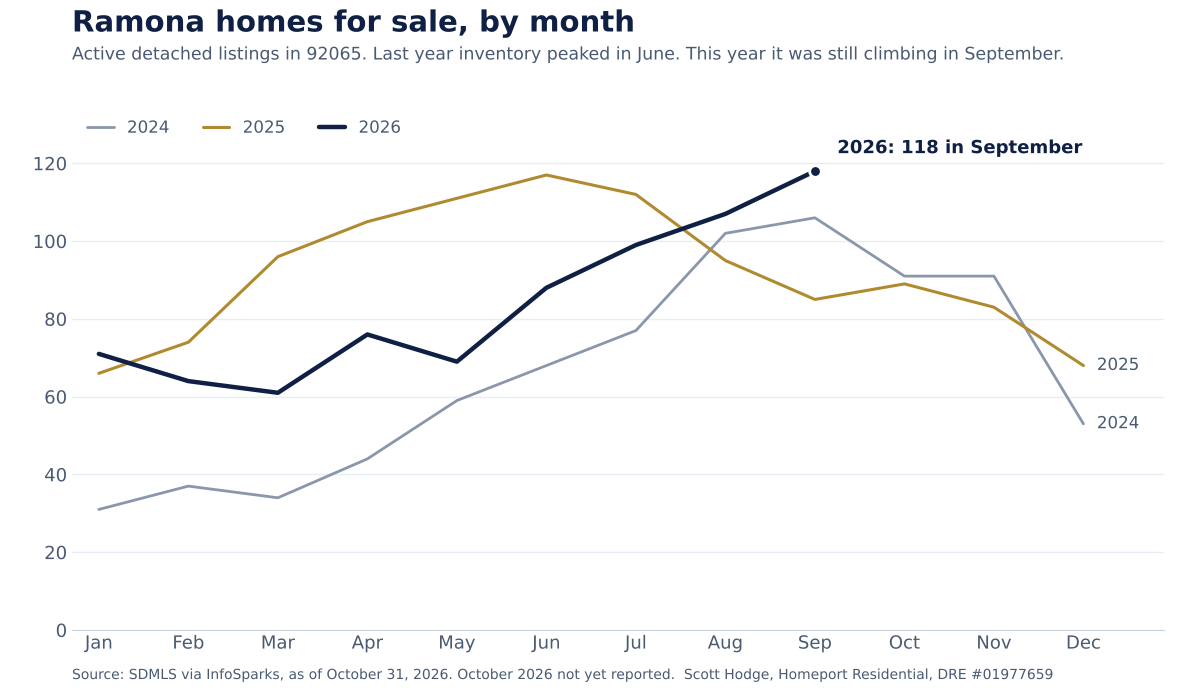
The wider picture is worth watching. Ramona's active detached listings reached 118 in September, the highest count since at least January 2023, and unlike last year inventory was still climbing into fall rather than falling after a summer peak.
For the full town wide breakdown, see the October 2026 Ramona CA detached homes market analysis on Homeport Residential.
Frequently asked questions
How many homes sold in San Diego Country Estates in October 2026?
10 detached homes closed in San Diego Country Estates during October 2026, up from 5 in September and down slightly from 13 in October 2025. The median sold price was $782,500 and the median days on market was 47.
What is the current months supply of inventory in SDCE?
San Diego Country Estates detached homes had 3.5 months supply of inventory at the end of October 2026, calculated as 35 active listings divided by 10 closed sales for the month. Measured against the three month average pace of about 8.7 sales a month, the same listings work out to about 4.0 months. Under 3 months is a seller's market, 3 to 6 is balanced, and above 6 favors buyers. The running record reads 2.2 in April, 2.6 in May, 3.6 in June, 3.7 in July, 3.7 in August, 7.6 in September and 3.5 in October.
Is the SDCE market getting stronger or weaker?
Sales recovered, but sellers have less leverage. Closings doubled from 5 to 10 and months supply fell back to 3.5, so September's slow month was a pause, not a turn. At the same time, 7 of 10 October sellers accepted less than their original asking price, and the median home took 47 days to sell, the longest of the past three months.
Did home prices fall in San Diego Country Estates in October 2026?
No. The median fell from $818,000 to $782,500, but the typical home that sold was smaller. Median price per square foot rose from $351 to $390, essentially even with $386 in October 2025. Against October 2025, the median sold price is up slightly, from $770,000.
What was the price range of SDCE detached home sales in October 2026?
October 2026 detached sales in SDCE ranged from $658,500 to $1,050,000. The median was $782,500 and the average was $799,750. One home closed above $1 million, the first since July.
Should I list my SDCE home now or wait?
That depends on your situation. October showed that buyers are still there and prices are holding, but they are taking their time and negotiating off the original asking price. A home priced to recent sales from the first day still sells. An optimistic price now tends to mean a longer wait and a cut. It comes down to your own timing and your home's position in the market.

Want a straight read on your specific situation?
The numbers in this report are averages. Your home is not an average. I will give you an honest assessment of where your property sits in the current SDCE market, including telling you if waiting makes more sense than listing.